As Bitcoin (BTC) continues its climb toward its all-time high (ATH), several technical patterns and time-based indicators have turned bullish, suggesting the flagship cryptocurrency may be on the verge of parabolic gains in the coming weeks.
These Indicators Hint At Parabolic Rally For Bitcoin
In an X post published today, crypto analyst Jelle noted that BTC has broken out of a bullish pennant and completed a successful retest – signaling its readiness for a new ATH. The analyst added that the bullish pennant projects a potential target of $150,000.

For the uninitiated, a bullish pennant is a continuation pattern that forms after a sharp upward move, followed by brief consolidation within converging trendlines. A breakout above the pattern typically signals a continuation of the uptrend.
Fellow crypto analyst CryptoGoos highlighted another bullish structure – the inverse head and shoulders pattern. They shared the following weekly BTC chart and stated, “this is not the time to flip bearish on Bitcoin.”
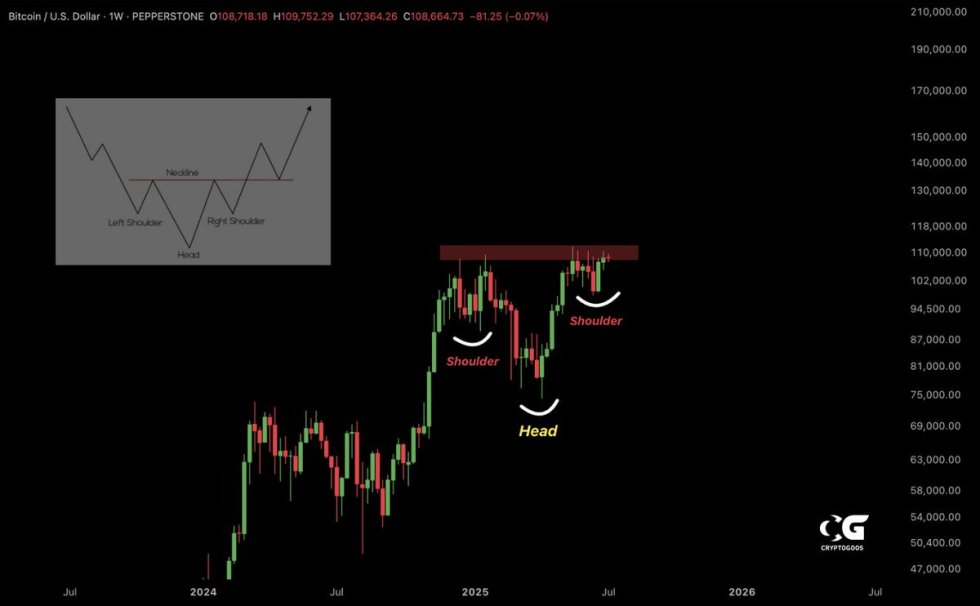
To explain, while a normal head and shoulders pattern is bearish for the underlying asset, an inverse variation of the pattern is bullish. The pattern is characterized by three troughs – two shallow shoulders on either side of a deeper head – followed by a breakout above the neckline.
Crypto trader Merlijn The Trader drew parallels between the current BTC cycle and the 2013–2017 run. The analyst shared the following chart showing that BTC has completed an ABC pattern on the weekly timeframe, followed by a prolonged consolidation and a successful breakout retest.
Meanwhile, seasoned analyst Titan of Crypto shared an interesting correlation between BTC cycles and US elections. Historically, BTC has topped approximately 53 weeks after a US election.
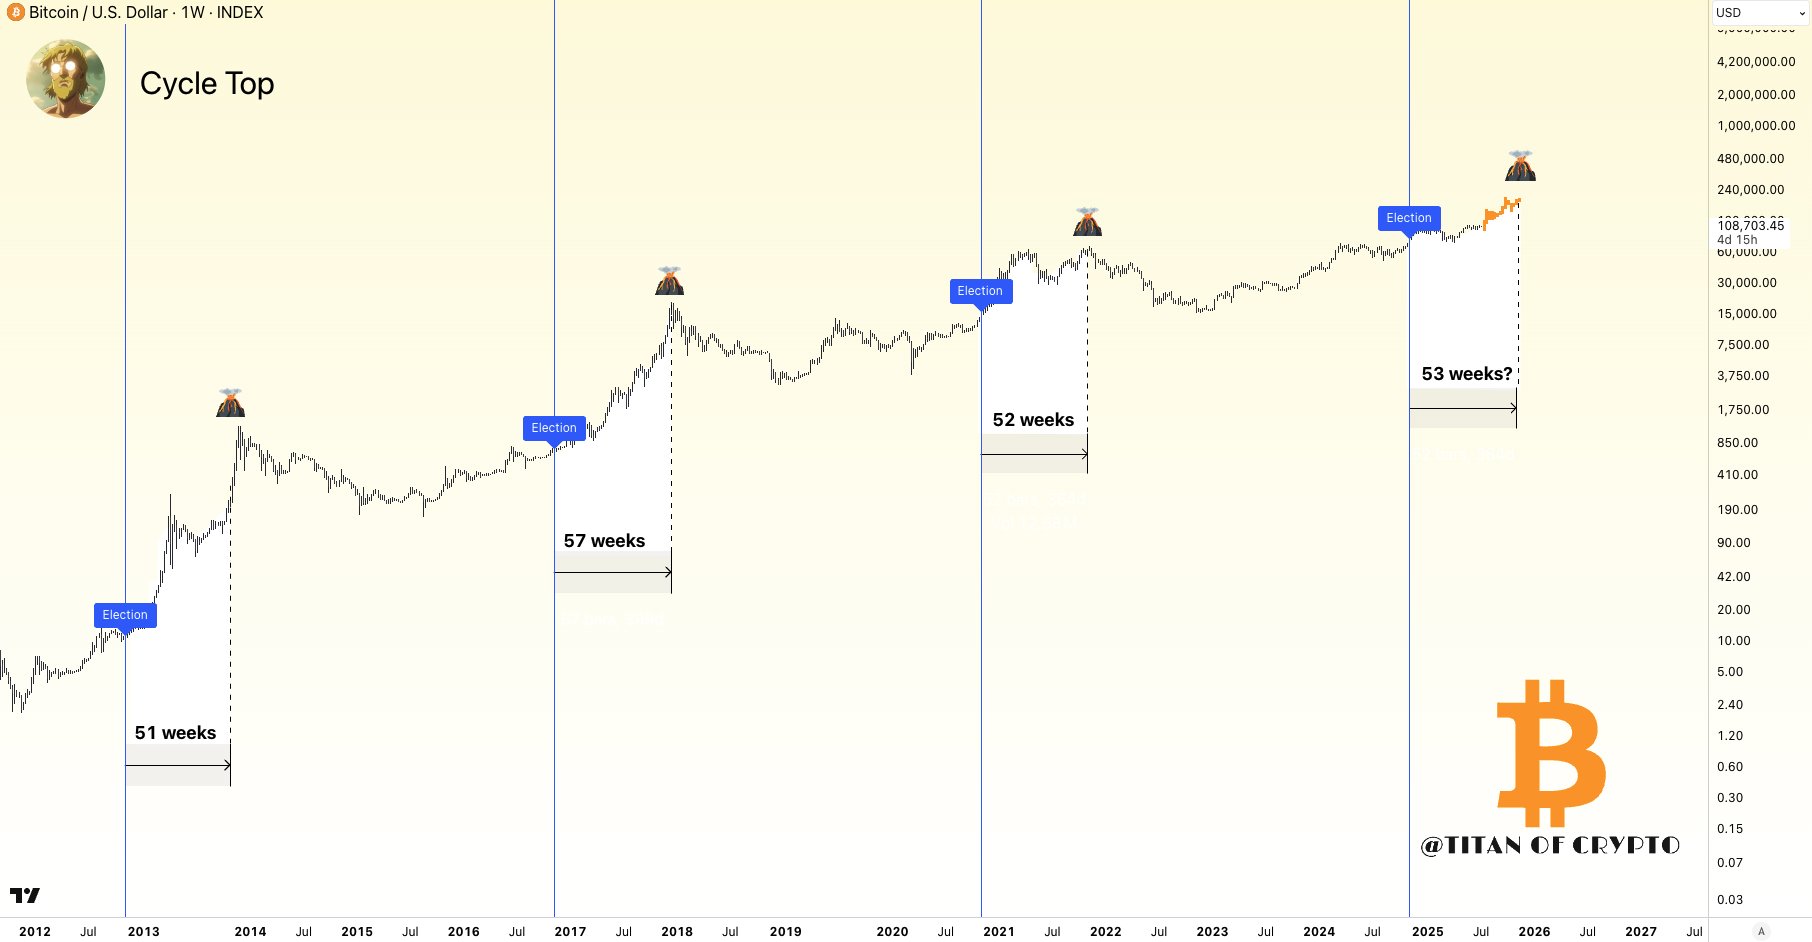
Since the last US election was in November 2024, it’s been 36 weeks. This suggests that a BTC peak could arrive within the next 17 weeks if historical patterns hold.
BTC Exchange Reserves Drying Up
On-chain data also paints a bullish picture. According to a recent CryptoQuant Quicktake post by contributor Chairman Lee, BTC exchange reserves have fallen to a multi-year low of 2.4 million BTC.
Declining exchange reserves typically signal a tightening supply, which can precede major bullish moves as demand outpaces available BTC. The analyst noted that the current trend mirrors the 2020–2021 bull cycle.
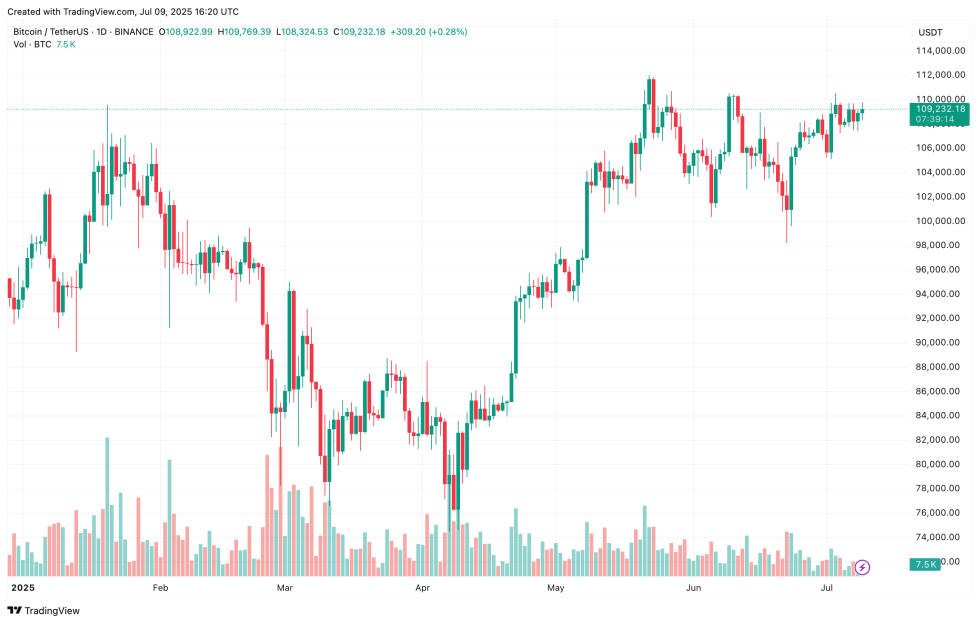
That said, not all indicators are bullish. The TD Sequential recently flashed a warning signal, hinting at a possible correction that could push BTC as low as $40,000. At press time, BTC trades at $109,232, up 0.9% in the past 24 hours.

You can get bonuses upto $100 FREE BONUS when you:
💰 Install these recommended apps:
💲 SocialGood - 100% Crypto Back on Everyday Shopping
💲 xPortal - The DeFi For The Next Billion
💲 CryptoTab Browser - Lightweight, fast, and ready to mine!
💰 Register on these recommended exchanges:
🟡 Binance🟡 Bitfinex🟡 Bitmart🟡 Bittrex🟡 Bitget
🟡 CoinEx🟡 Crypto.com🟡 Gate.io🟡 Huobi🟡 Kucoin.


Comments