Bitcoin broke through the $100,000 level this week, reaching $104,000 before moderating to about $103,000. The move came after news that US and Chinese officials would sit down in Switzerland to talk about a possible trade agreement. Markets responded promptly. Optimism returned, and Bitcoin rose accordingly. But analysts are seeing beyond the headlines. Global liquidity is the real story.
Global M2 Reaches $111 Trillion
Julien Bittel, a macro researcher at Global Macro Investor, is of the opinion that global M2 money supply is a good leading indicator of where Bitcoin is going. He presented a chart illustrating a 12-week lag between increasing M2 and the price of the top crypto. Briefly put, when M2 increases, Bitcoin follows around three months later.
Lots of you have been asking for the updated Global M2 vs. Bitcoin chart. Well, here it is…
And yes – it still tells the same story:
We’re going higher… pic.twitter.com/kv7QSE9iGN
— Julien Bittel, CFA (@BittelJulien) May 9, 2025
Between early 2023 and early 2024, global M2 increased from $98 trillion to slightly over $108 trillion. Bitcoin came along, finally breaking above $100,000. But mid-2024, M2 ceased its ascension for a period.
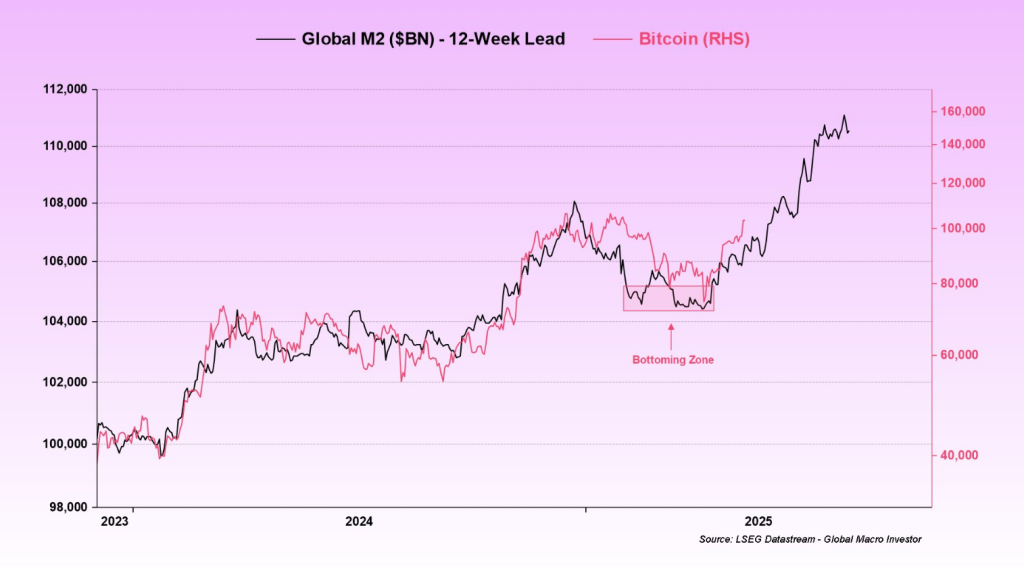
Bitcoin also tapered off, falling below $80,000 during that period. Bittel referred to that range as a consolidation phase. Today, M2 is moving once again—quickly. It’s passed $111 trillion. If that trend continues, BTC could keep rising into mid-2025.
Bittel said, “We’re going higher,” pointing to the strong rise in global M2 as the signal.
Others Think Bitcoin Is The Top Dog
Not everyone agrees with Bittel’s timeline. Analyst Benjamin Cohen raised doubts about the idea that the crypto asset always lags behind liquidity changes. He pointed out that Bitcoin hit its highs in 2017 and 2021 before M2 peaked. That doesn’t fit the theory of M2 leading BTC by 12 weeks.
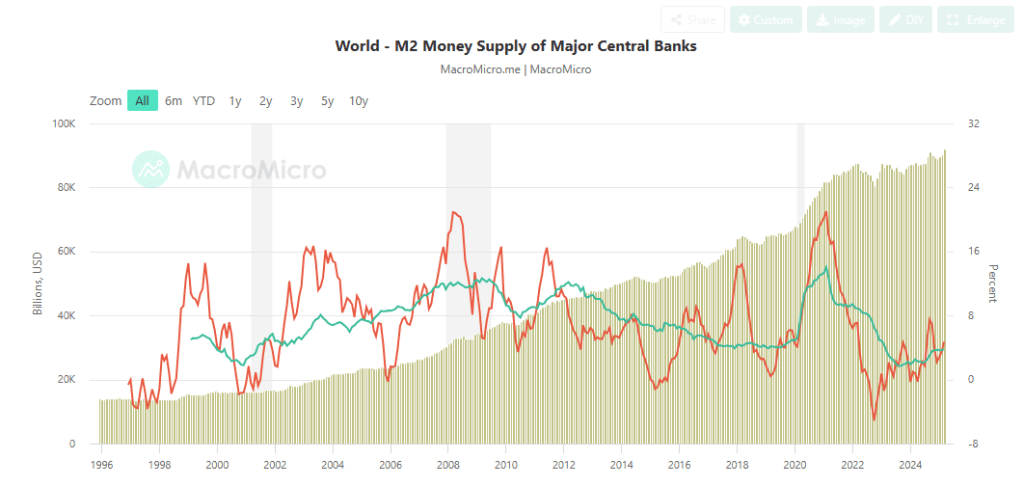
Cohen provided an alternative perspective. He believes Bitcoin could very well lead, with changes to M2 appearing later. If that’s the case, then the coin’s recent ascent is perhaps forewarning us that global liquidity could decrease in the coming months.
FTX Collapse Still EchoesWhat if #Bitcoin leads liquidity, rather than lags it?
A lot of people show this chart, where they offset global M2 by 3-4 months and show BTC following it.
The problem is that in 2021, this offset shows M2 going up for 6 months after BTC topped. pic.twitter.com/gpkbW9jboG
— Benjamin Cowen (@intocryptoverse) May 8, 2025
Cohen also referenced what occurred in 2022, when Bitcoin fell hard. That drop coincided with M2 bottoming out—but the drop persisted longer due to the FTX debacle. He maintained that Bitcoin’s price movements do not always adhere to the same timeline as M2. Exchange failures like the one experienced can disrupt the rhythm.
This perspective uncovers another type of forecast. If BTC is trailing, rather than leading, then the current rally may indicate danger on the horizon—not resilience.
Featured image from Pexels, chart from TradingView

You can get bonuses upto $100 FREE BONUS when you:
💰 Install these recommended apps:
💲 SocialGood - 100% Crypto Back on Everyday Shopping
💲 xPortal - The DeFi For The Next Billion
💲 CryptoTab Browser - Lightweight, fast, and ready to mine!
💰 Register on these recommended exchanges:
🟡 Binance🟡 Bitfinex🟡 Bitmart🟡 Bittrex🟡 Bitget
🟡 CoinEx🟡 Crypto.com🟡 Gate.io🟡 Huobi🟡 Kucoin.


Comments